(Dynamic Advisor Solutions) It has been six weeks since the Federal Reserve (Fed) commenced its easing campaign with a 50-basis point (bps) “jumbo” cut to interest rates. This week, an additional 25 bps cut is widely anticipated at the November 6-7 Federal Open Market Committee meeting.
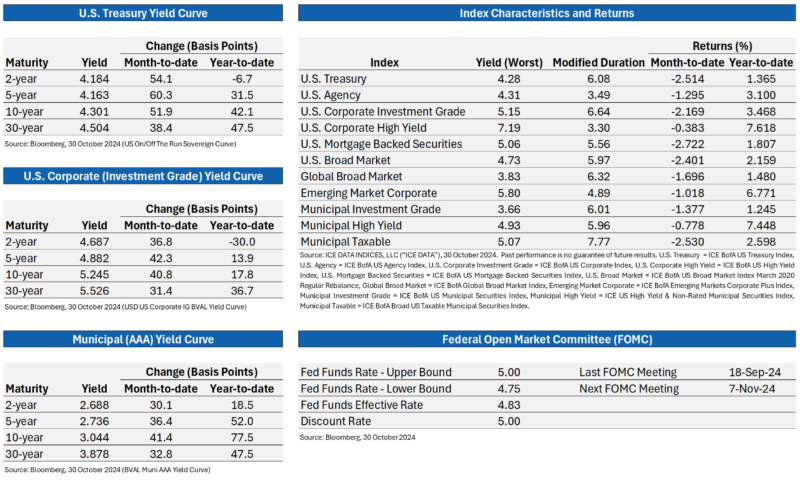
While shorter bonds have largely performed as expected in this environment, longer maturities across major fixed income indices have seen yields spike higher. Nowhere is this more apparent than the U.S. Treasury market, where yields from two to thirty years have risen over 50 bps ± since September 18.
The largest driver of this move appears to be the strength of the U.S. economy, which many believe will result in a more measured approach to policy easing than initially anticipated. Today’s third-quarter GDP print at 2.80% should reinforce this narrative, as growth in 2024 appears on target to exceed the Fed’s 2% projection.
Bloomberg’s interest rate probability model now calls for approximately 125 bps in total cuts by the end of 2025, roughly 75 bps lower than estimates from early October. This recalibration has led to negative performance across most fixed income indices this month, with U.S. mortgage-backed securities, Treasuries, and taxable municipal bonds seeing the largest underperformance. The charts below summarize the yield change and performance of select fixed income tenors and indices as of October 30.
[Click on image of charts and graphs to enlarge.] 
Past performance is no guarantee of future results.
Higher Yields After a Rate Cut?
While current fixed income market volatility may seem surprising, our research indicates that negative performance after a first cut isn’t unusual over shorter time horizons. Looking at the beginning of the previous ten easing cycles since 1989, the six-week performance of the U.S. Bloomberg Aggregate Bond index was negative 40% of the time (4/10). Broadening the scope to include all fifty-seven rate cuts since June 1989, six-week performance was negative nearly a third of the time (18/57). While we are still in the early innings of this easing cycle, lower prices and higher yields seem reasonable given the uncertainty surrounding the future path of interest rates.
Yield Opportunities Abound
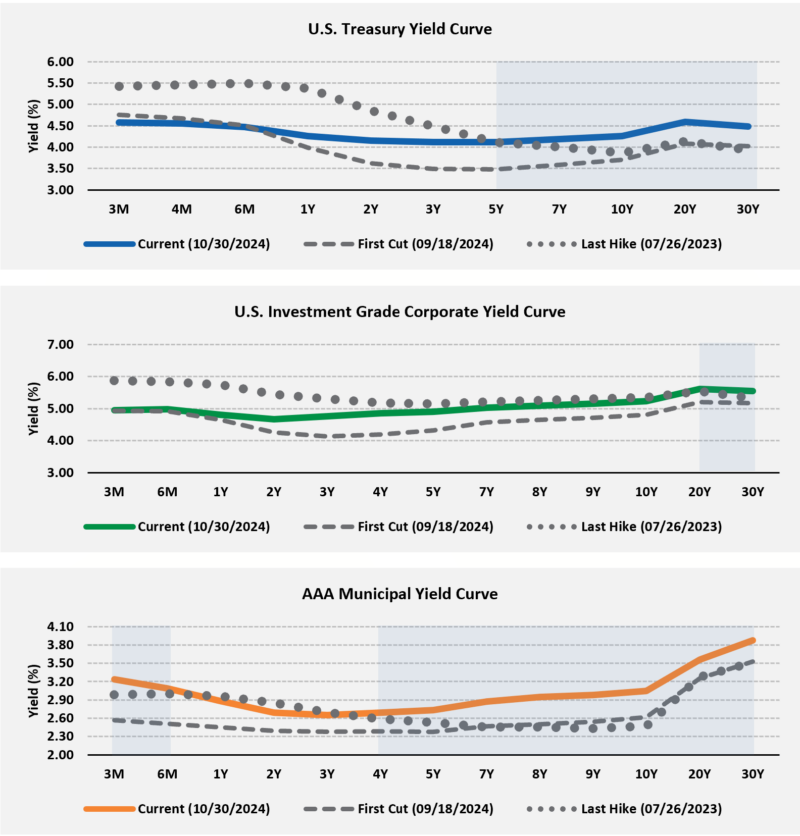
The recent pullback in prices across the fixed income markets should provide income-oriented investors additional opportunities to add yield to their portfolios. For example, the U.S. Bloomberg Aggregate Bond index currently yields about 4.70%, nearly 60 bps above the year-to-date lows set in September and over 180 bps more than its ten-year average of 2.87%. The charts below compare the current yield curves (10/30/24) of U.S. Treasury, U.S. investment grade corporate, and AAA municipal bonds to 1. The yields available after the first rate cut of this cycle (09/18/2024) and 2. The last rate hike of the previous tightening cycle (07/26/2023).
[Click on image of charts and graphs to enlarge.] 
Source: Bloomberg. Past performance is no guarantee of future results.
As shown, longer maturities broadly yield more today than after the last rate cut in September. Even more interesting, the data reflects we are getting higher yields than when the Fed was hiking rates, as shaded in blue. Rather than retreat from duration, now may be a good time to explore maturities farther out on the curve, especially for investors looking to lock in yields for the long term.
A prudent approach to fixed income investing calls for diversification across both credit and duration exposure. As always, Dynamic recommends staying balanced, diversified and invested. Despite short-term market pullbacks, it’s more important than ever to focus on the long-term, improving the chances for investors to reach their goals.
Should you need help navigating fixed income for your clients, please contact Dynamic’s Investment Management team at (877) 257-3840, ext. 4 or investmentmanagement@dynamicadvisorsolutions.com.
Bill Smith serves as president, Portfolio Management & Trading, of Harmont Fixed Income in Phoenix


