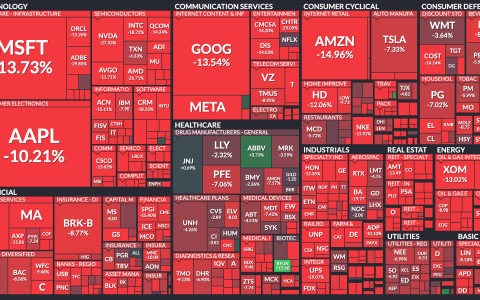

(Kostya Etus, Dynamic Advisor Solutions) While we may be seeing an uptick in volatility recently, driven primarily by uncertainty surrounding economic growth, it’s important to remember that the market had a great first half this year, with the S&P 500 up close to 20% through the end of August. While market performance has largely been driven by Nvidia and the “Fabulous Three”—Amazon, Facebook/Meta, and Microsoft—we have also seen more broad-based positive performance from other areas of the market given continued favorable data releases. The key metrics supporting the market include:
- Inflation Continues to Fall: The most notable recent news was the July Personal Consumption Expenditures Price Index (PCE) from the U.S. Bureau of Economic Analysis, which surprised with a rate of 2.5%. Core PCE—less food and gas—is the Federal Reserve’s (Fed) preferred gauge for inflation, also came in below expectations at 2.6%. Lower inflation bodes well for interest rate cuts later this year by the Fed.
- Broadening Corporate Earnings: Earnings season is close to completion with 93% of S&P 500 companies reporting results as of 8/16/2024. According to FactSet, the current year-over-year earnings growth rate is 10.9%. If this was the actual growth rate for the quarter it would be the highest rate since 2021 and well above expectations. More importantly, nine out of the eleven sectors are showing positive growth. This is a sign that other areas of the market—outside of technology and communication services stocks—may see a favorable reversal.
- Labor Market Balancing: The unemployment rate ticked up to 4.3% in July. While this is the highest rate since late 2021, it remains a historically low rate and not necessarily a bad sign as it supports a cooling, yet positive, economic growth. It is important to note that an updated estimate of second-quarter GDP growth came in at 3%, this is close to double first-quarter’s growth and higher than expectations. The economy remains resilient and certainly doesn’t point to a severe recession on the horizon.
Lower inflation with a balanced economy is the scenario that the Fed has been looking for to start cutting rates later this year. This would be beneficial for most broad-based asset classes including stocks, bonds, and real estate. A rate cut, paired with strong corporate earnings, could be particularly beneficial for undervalued areas of the market, such as small-cap and value stocks, reinforcing the benefits of diversified portfolios when investing for the long-term.
Asset Class Returns Through the First Half of 2024
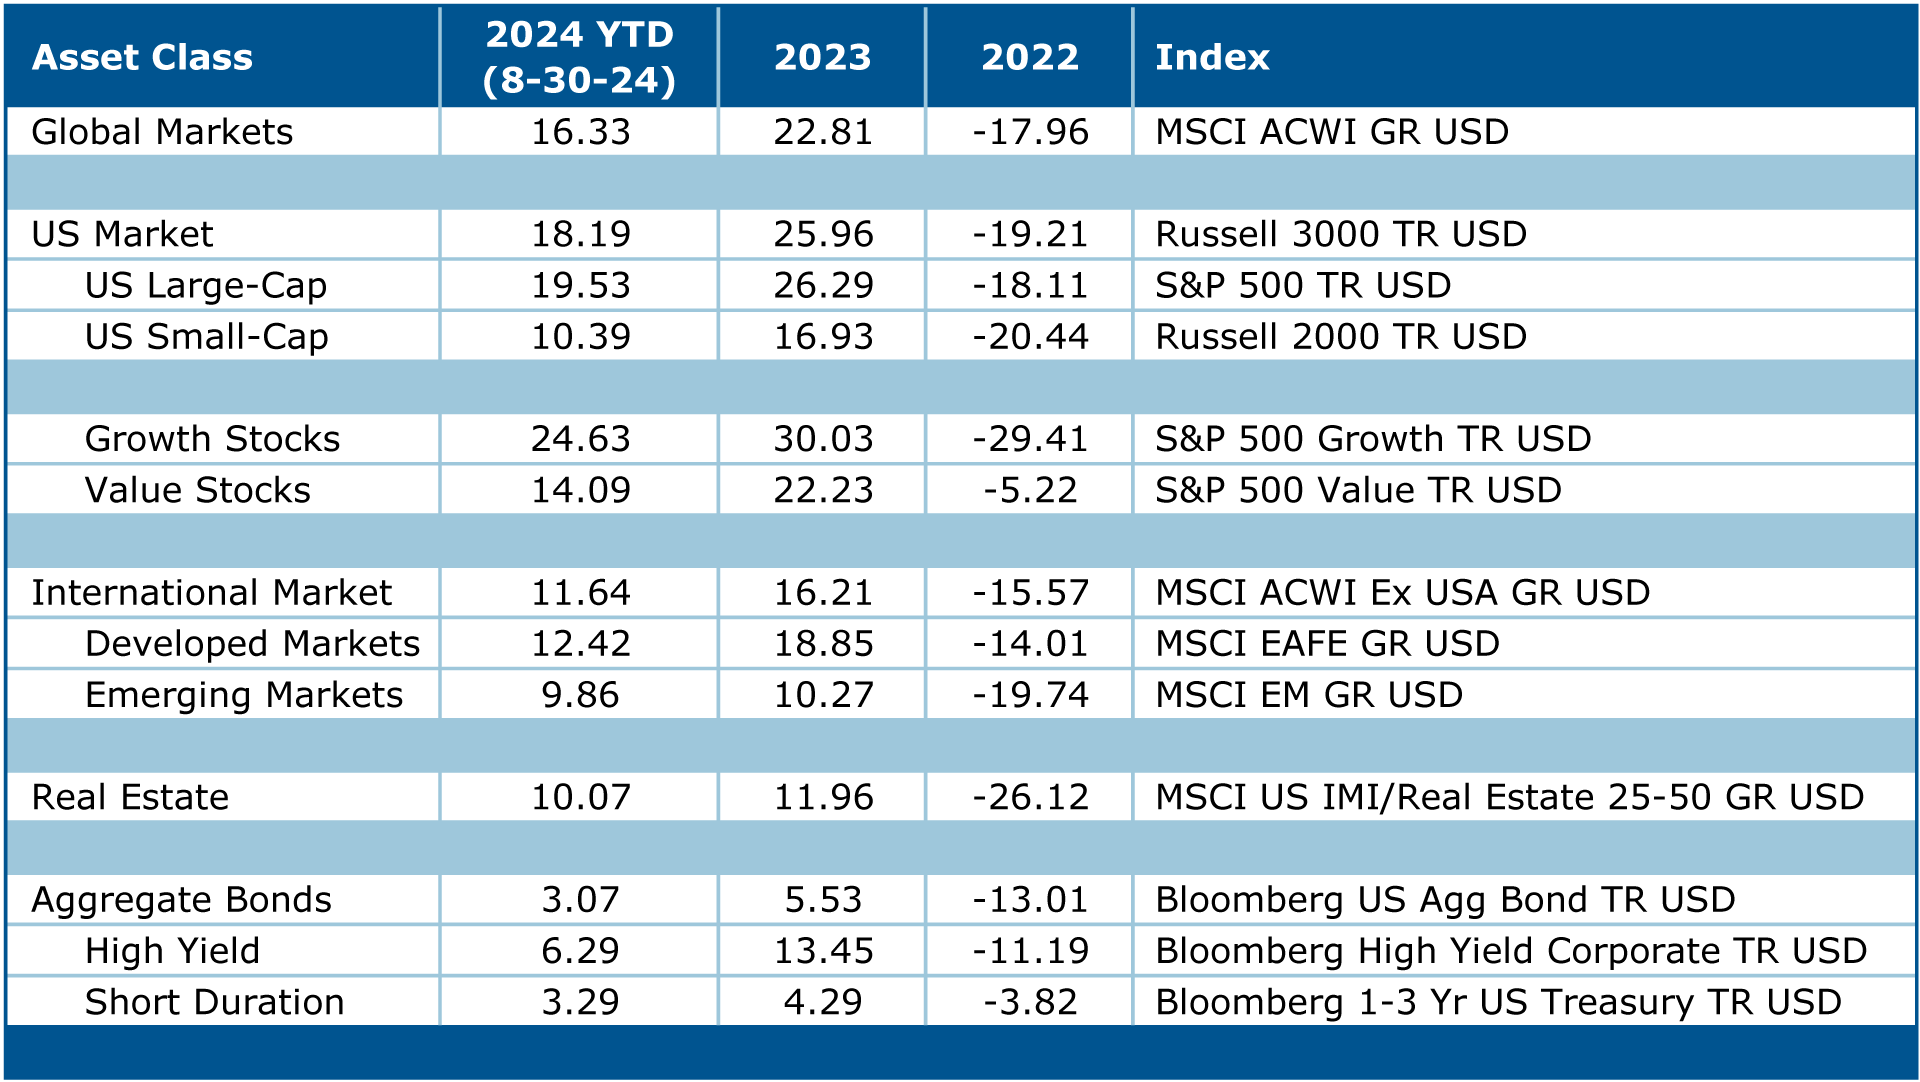
Source: Morningstar Direct as of 08/30/2024.
Key Takeaways:
- Market volatility is leaving investors in pain, behavioral finance may be the cure.
- Concentration risk is particularly high right now, a math lesson can help reduce the risk.
- Uncertainty is leading to fear, diversification is coming to the rescue.
Perception Versus Reality for Investment Returns
The recent volatility that we are seeing in the markets may be leaving some investors uncomfortable. After all, when the market takes a tumble, it’s natural to feel some internal pain, after all loss hurts. There is some science behind it. Prospect theory is a concept in behavioral economics based on a study done by Daniel Kahneman and Amos Trevsky, for which Kahneman won a Nobel prize in 2002 as the pioneer of integrating psychology into economics.
I sum up his findings with a simple drawing:
- Loss Aversion: Humans feel the emotional impact of loss much more than pleasure from gains. In fact, it is estimated that the impact of losses is double that of equivalent gains.
- Investment Implications: While history would suggest that stocks provide the highest returns over the long-term, and saving for retirement is a long-term game, loss aversion is powerful enough to impact decision making for most investors. This is why many continue to holds significant allocations in bank accounts, which yield almost nothing, but give us peace of mind that the money will not be lost.
- Controlling Emotions: It is healthy to understand and manage risks as best as possible to avoid detrimental losses. But the biggest risk is always not having enough savings in retirement. By understanding our behavioral tendencies and the concept of loss aversion, we can be more conscious of short-term losses and focus more on long-term gains.
What Gaining and Losing 10% in the Market Feels Like
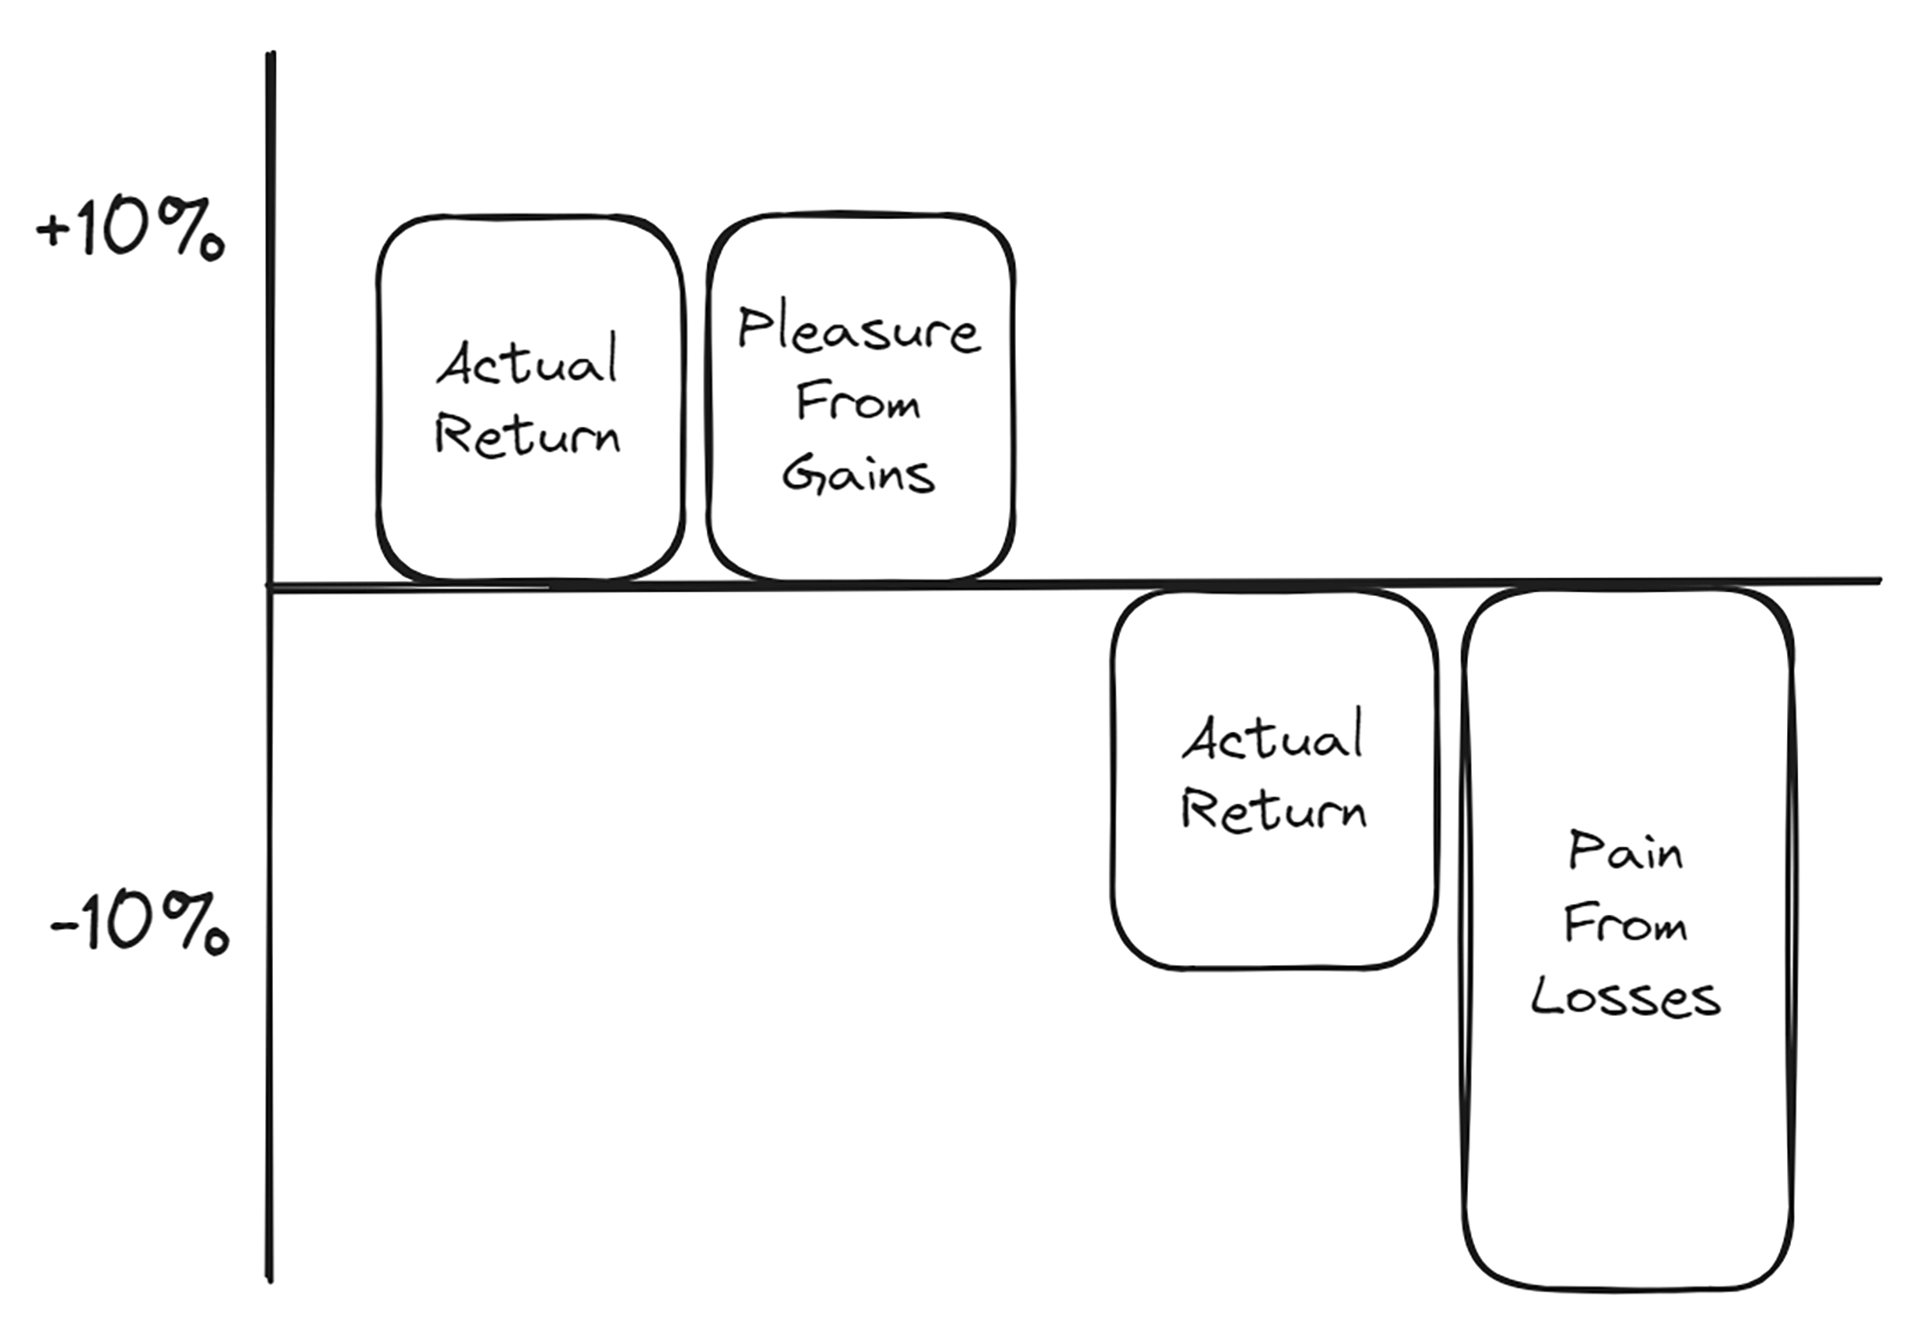
Source: Kostya Etus
Diversification Math Lesson
As discussed above, we are seeing concentration risk in certain areas of the market, particularly with a handful companies that have driven a large portion of total market returns over the past year and a half. These companies are now trading at very high valuations and, given that markets are cyclical, there may be a reversal of fortunes coming up, while other companies catch up.
Over-concentrating to fewer areas of the market leaves your portfolio open to the risk of more severe drops, which may be hard to recover from. The chart below helps to illustrate how diversification can help alleviate some of these risks:
- The $100 Example: Let’s say you start with $100 and in year 1 your portfolio drops 10%, you are left with $90. In year 2, the market rebounds 10%, and you rejoice, until realizing you only have $99. You actually need an 11% rebound in year 2 to get back to your starting amount of $100. The balance between losses and gains needed to recover is not symmetric, and the more you lose, the harder it is to recover.
- Win by Losing Less: By allocating to a variety of asset classes that are less correlated with each other, you are able to dampen the losses in any period. If you lose less, then it becomes easier to recover when the rebound occurs. This is particularly true for more severe market drops. Notice that a 50% loss requires a 100% gain to recover but a slightly larger 60% drop needs a whopping 150% return to make it back.
- Diversification for the Long-Term: A globally diversified and balanced portfolio approach helps support a smoother ride over the long-term, with less severe drawdowns. During the 2007-2009 Financial Crisis, the S&P 500 lost about 51%, which would have required close to a 105% return to recover. Meanwhile, a 60% global stock / 40% bond diversified portfolio would have lost about 35%, only requiring a 53% recovery to recoup losses.
Percentage Return Required to Fully Recover from a Loss
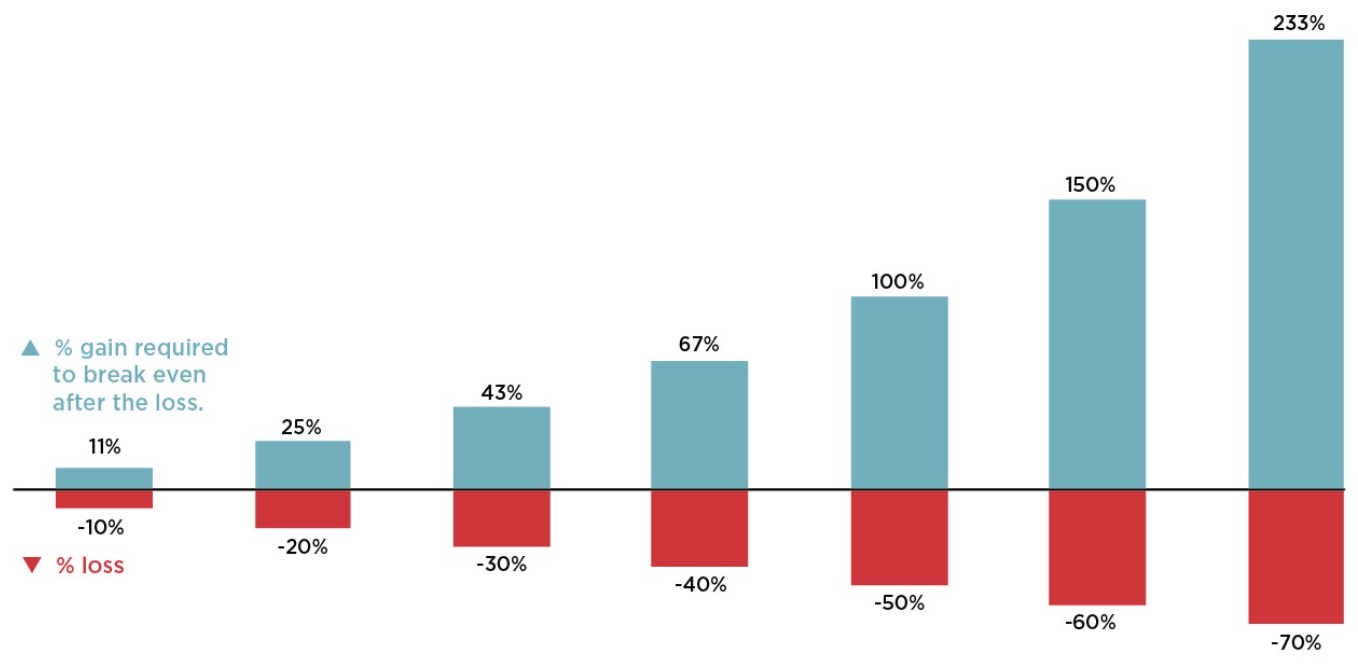
Source: Nationwide IMG Competitive Intelligence Team.
Risk vs. Reward
As volatility and uncertainty heat up, investors may experience fear. Fear and investing don’t mix well as it may lead to bad investment decisions. But there are solutions to help alleviate that fear.
The chart below helps to understand a variety of key investor concepts:
- Focus on Risk Management: Investors cannot control market returns, but they can control what risks they take within their portfolios. Taking on too much risk can result in sustained periods of negative returns and potential for large losses over shorter periods of time. Taking on a low amount of risk may make investors more comfortable, but it could limit the return potential needed to reach investment goals. Choosing an appropriate amount of risk for a given investment goal helps investors succeed.
- Diversification Provides Stability: One of the best ways to combat uncertainty, volatility, and fear is to invest in balanced and diversified portfolios made up of a variety of asset classes. By allocating to a diversified portfolio, you are better able to weather market downturns while still participating in market upside. Diversifying investments helps investors succeed.
- Investing for the Long-Term: While investing in in a mix of stocks and bonds increases the probability of positive returns over shorter time periods, it is fascinating to see that the percentage of positive returns for rolling 20-year periods is 100% for both stocks and bonds. Focusing on the long-term truly helps investors succeed.
Risk-and-Reward Trade-Off for Different Asset Classes
Average Annual Returns 1978-2023
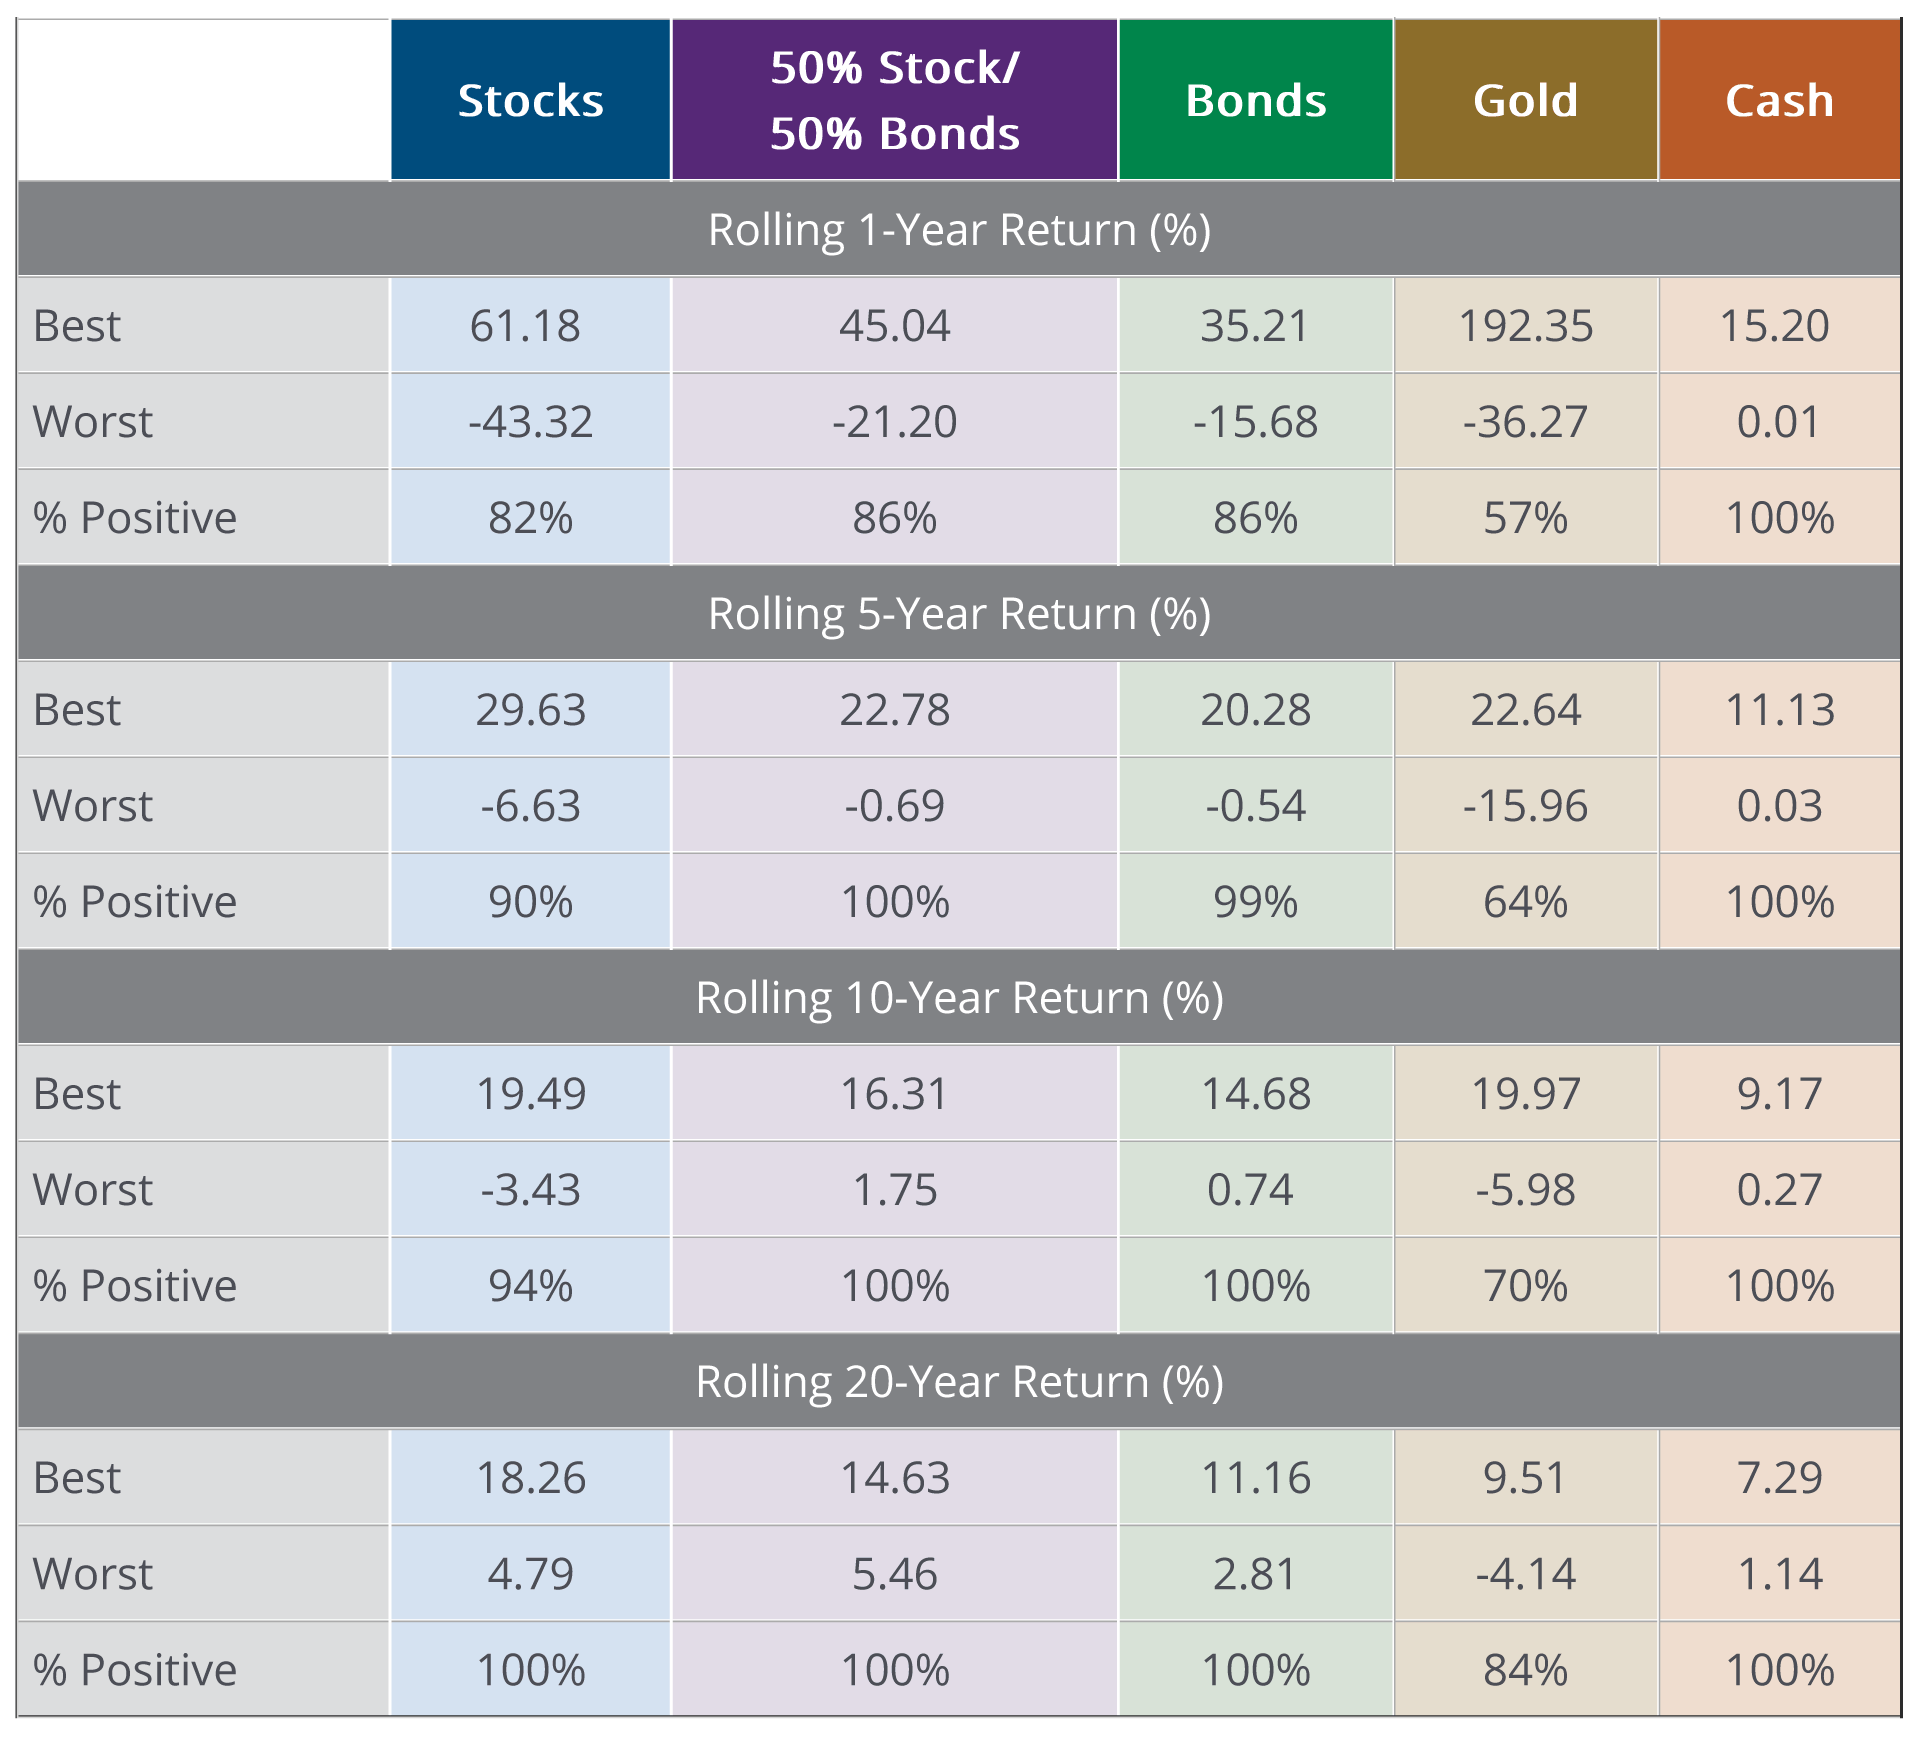
Source: Hartford Funds. As of 12/31/23. Past performance does not guarantee future results. % Positive in the chart is the percentage of time each asset class had a positive return based on rolling monthly returns for the time periods shown; results may be rounded. For illustrative purposes only. Data Sources: Morningstar and Hartford Funds, 5/24.
Stay diversified, my friends.
As always, Dynamic recommends staying balanced, diversified and invested. Despite short-term market pullbacks, it’s more important than ever to focus on the long-term, improving the chances for investors to reach their goals.

