(Morningstar Managed Portfolios) Following several years of FAANGM outperformance, these six stocks remain a formidable force with enormous popularity. Given the concentration of these stocks, we spoke to John Owens and Tyler Dann to capture their expert views via a Q&A format. Here is what they had to say.
John, do FAANGM stocks feature at the top or bottom of your list as a Portfolio Manager?
While FAANGM may be a catchy acronym, we don’t paint these stocks with such a broad brush. They do share some common characteristics (fast growing, mega-cap ‘tech’ stocks), but there are some significant differences in their business models and competitive positioning as well as the attractiveness (or unattractiveness) of their stock prices. So, we evaluate each stock on its own individual merits.
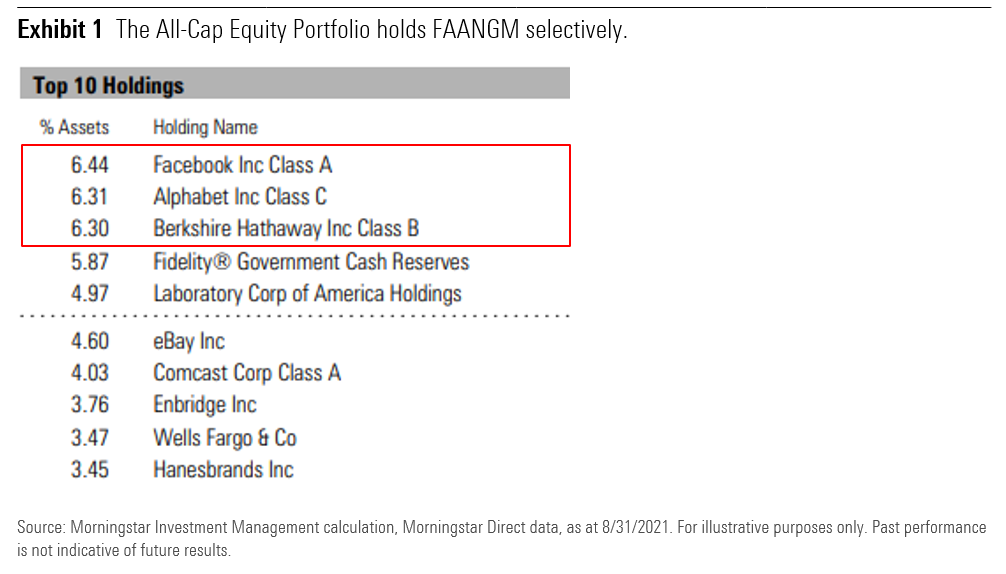
In All-Cap Equity, which is our go anywhere portfolio, we very much like Facebook and Alphabet, both of which we’ve held for many years and they are also our two largest positions in the portfolio. We have indirect exposure to Apple through our Berkshire Hathaway position, our third largest holding.
We have no exposure to Amazon, Netflix, or Microsoft. We think these are great businesses, but their share prices currently do not meet our strict valuation criteria for this strategy. Plus, we only hold 36 stocks in this portfolio2, so they have plenty of company in being excluded from our portfolio.

Can you talk us through these FAANGM stocks and anything that currently worries you? For example, extremely high price/earnings ratios?
Well, let’s first start with some Morningstar Equity Research ratings. According to the analysts, Facebook, Amazon, Alphabet, and Microsoft all possess wide economic moat ratings (or durable competitive advantages), whereas Apple and Netflix have narrow economic moats.
Plus, the analysts also believe that Apple and Netflix are overvalued, trading at 22% and128% premiums, respectively3. We’d also note that Amazon and Netflix trade for roughly 50 times Bloomberg consensus earnings estimates for the current year4. So, the valuations on some of these stocks are worrisome.
But, we’d note that both Facebook and Google trade for a more reasonable 24 times 2021 earnings5, which is a very modest premium to the market, especially considering their competitive strengths, excellent growth prospects, and rock-solid balance sheets. So, again, we don’t paint with a broad brush here.
The FAANGM stocks also face a variety of risks, including increased regulatory scrutiny (both in the U.S. and around the world), more head-to-head competition (e.g., Microsoft and Google attacking Amazon’s cloud business; Amazon Prime Video and Apple TV versus Netflix streaming service, Amazon and Google pushing into Apple’s hardware business, etc.), and challenges from new disrupters (e.g., TikTok luring users away from Facebook, additional online ad platforms potentially slowing Alphabet’s revenue growth, etc.). Even if the companies maintain their leadership positions, they may not meet the market’s lofty growth expectations. We also think declining interest rates have flattered the valuations on these growth stocks, much more so than those of value stocks.
Tyler, can you unpack the outperformance of FAANGM? Is it simply higher growth in technology companies?
Yes, higher growth rates in tech do explain some of the changing shape of the U.S. equity market. As is often the case, it’s a bit more complex when you go under the hood.
First of all, let’s figure out what “technology” means, because companies such as Alphabet, Amazon and Facebook, that most would associate with “technology” are, from a sector classification perspective, allocated to other sectors such as Consumer Discretionary and Communication Services. When we expand the list of companies to include these type of companies, we see that the “technology” weighting within the Morningstar US Market Index has dramatically increased over the past decade or so, from 19.78% in 2010 to 37.62% most recently6.
Part of this can be attributed to earnings contribution. When you measure the earnings contribution of technology companies, using the same categorization as before, we see that these companies accounted for 18.6% of the Morningstar US Market Index’s earnings in 2010. In 2021 year-to-date, this contribution has been 32%. So, this certainly implies that earnings growth delivered by technology companies has been superior and would therefore merit some increased representation in the index.
Obviously, that does not explain the entirety of the weighting increase. Most of the rest of this can be explained by P/E multiple expansion – or said simply, how much people are willing to pay for a dollar of profit. In 2010, again using the same grouping of technology companies, the P/E multiple was 18.7 times. Today it is 35 times.
Supporters of FAANGM stocks would cite technological disruption and better ESG standards (environmental, social and governance) as key reasons for outperformance. How would you respond to this?
I think there is some merit to this argument. It’s often instructive to decompose potential sources of outperformance into “buckets”. I can think of at least three, including – first, differentials in growth; second, differences in in valuation; and third, differences in yield.
If we then think through these concepts of technological disruption and better ESG standards with a mind towards which bucket of outperformance they might impact. Technological disruption would probably impact differences in growth – companies benefitting from technological disruption would presumably experience better growth, and vice-versa.
ESG standards would also potentially impact growth rates in the long run, but more immediately, would impact investor sentiment, which in turn could contribute to differences in valuation – with companies displaying better ESG characteristics garnering higher valuation multiples – and vice-versa.
Given the observations made earlier on the evolution of earnings contribution and P/E multiple of technology companies over time, it’s reasonable to conclude that technological disruption and better ESG standards would have contributed at least in part to this group’s outperformance.
So, what do you make of the extreme popularity in this space?
In short, we view extreme popularity as a warning sign. As long-term, valuation-driven investors with a contrarian mindset, one of the pillars of our investment process is the compilation and measurement of contrarian signals. The academic literature supports this approach, with unloved stocks having a tendency to outperform popular stocks.
Our approach measures three contrarian signals—expectations, positioning, and sentiment—and assigns a score to every asset class we consider. For some perspective as to where this analysis suggests we are today for technology companies, US technology companies receive among the lowest possible score from our investment universe of over 200 equity groups. We’d view this as a potential red flag.
John, there are growing mutters from some corners about concentration risk. Can you explain?
It’s interesting. Cap-weighted indexes tend to add stocks priced at high market valuations (e.g., Tesla entered S&P 500 in December 2020) and kick out stocks priced at deep discounts. This may mean buying high and selling low. The highest flyers also end up taking a greater percentage of the index over time. We think there’s reason for concern here. If the FAANGM stocks were to fall out of favor, it would be an enormous drag on the index. We’ve seen this before with the Nifty Fifty in the 1970’s and the technology bubble in the late 1990’s.
How do you deal with this concentration risk at the index level?
Fortunately, as active managers, we don’t have to track the index. On the contrary, as focused investors, we invest only in our highest conviction stock ideas. We aim to buy stocks at significant discounts to our estimates of their intrinsic value and to sell when they approach or exceed our estimates of their intrinsic value. In other words, we seek to buy low and sell high.
Of course, markets can remain irrational for lengthy periods of time and sometimes, high-flying stocks end up more than justifying their valuations. So, being different from the market can lead to bouts of underperformance and this is especially true for us when frothier stocks outperform. That said, we think our enduring philosophy and disciplined approach to investing should lead to better results over the long run.
So, what are your key positioning points within U.S. stocks today, acknowledging this overconcentration?
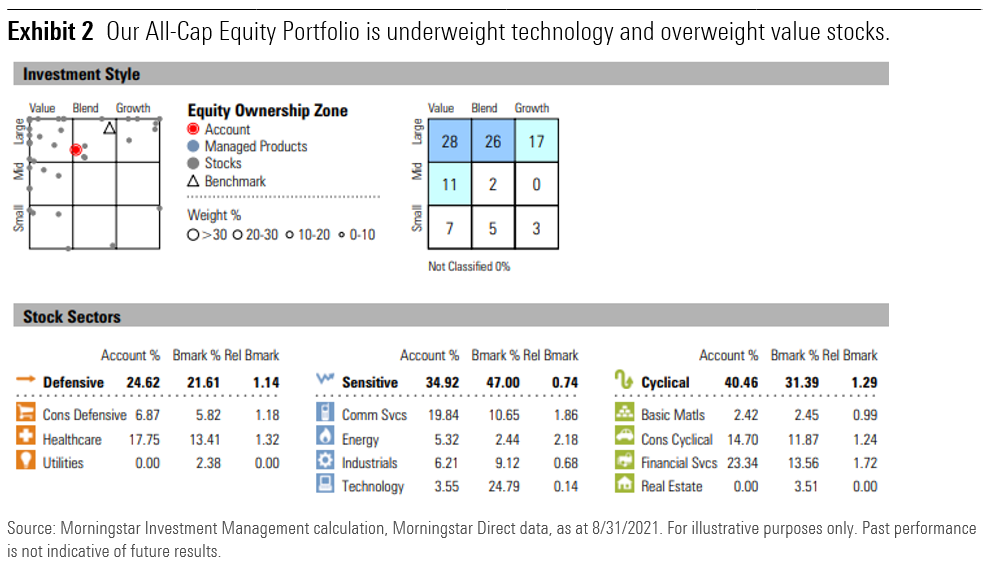
Again, All-Cap Equity is our go anywhere portfolio and we’re currently invested across the Morningstar style boxes (from small-cap to mega-caps, from deep value to high growth) and across various sectors.
The common theme is we like to invest in significantly undervalued high-quality stocks and we’ll selectively invest in deeply discounted lesser quality names as well. That said, the portfolio today, has a bias toward value stocks and this includes a significant overweight to financial services and a substantial underweight to technology stocks.
We've included a snapshot below from 08/31/2021 that will help illuminate this positioning.

And finally - do either of you have any parting wisdom for mom and pop investors out there as it relates to FAANGM stocks?
Beware of catchy acronyms. Earlier this century, the BRIC acronym (Brazil, Russia, India, and China; South Africa was added in 2010) was all the rage. They were the world’s fastest growing emerging market economies and lived up to the hype for years.
But, growth in those economies slowed after the global financial crisis and a subsequent collapse in the price of oil. So, most of the BRIC funds shut down or merged with other investment vehicles. Just as with FAANGM, there were significant differences in these countries’ economies. Brazil and Russia have continued to struggle, while India and China have rebounded.
We wouldn’t be surprised if we saw a similar divergence among the FAANGM stocks in the years to come, but by then Wall Street will be promoting another acronym!


