

Scott's note: Another bit of "competitive intelligence," this time from Comerica's investment and strategy team. This obviously came out the day before the Fed meeting so while the scenarios are good, it still reflects the fast-moving target that market commentary has become, especially in longer-form reports like this where one stale hypothetical can break the whole structure. Moral: control what you can control. Wait for the Fed before you publish. Your clients would rather get the reaction than the rumor.
---------
While the dog days of summer have arrived, investors have plenty to contemplate given a variety of developments on the political, interest rate and equity market landscapes.
Executive Summary
- Politics: We have recently experienced four “October Surprises” and it is still only July!
- Market Interest Rates: Bond traders are likely to force the Fed’s hand.
- Equities: After a strong start to the year, the equity markets have encountered headwinds, particularly in the large cap space, as equal-weighted measures and small caps have secured a bid.
Finally, the election and seasonality are bringing an increase in volatility.
The parlor games have started relative to beneficiaries of extended tax cuts and reduced regulation (cyclicals and value) in a Republican administration, with consumer stocks, clean energy and some healthcare related industries poised to outperform should the Democrats retain the White House.
At this point, we view these as speculative trades and encourage investors to maintain diversified, long-term strategies within their portfolios.
Politics
We have recently experienced four “October Surprises” and it is still only July!
To be sure, this presidential election season has been historic, with a conviction, a disastrous debate, an assassination attempt and a candidate’s withdrawal adding to the mix of uncertainty. During times like these, it is tempting to look to the U.K., which recently managed to select a new government in a matter of weeks - at a fraction of the cost - and without the attendant, seemingly unending, narrative-forming and stress-inducing media onslaught.
Despite the U.S. political drama, financial markets have performed relatively well, with market interest rates nudging lower and equities experiencing what appears to be nothing more than typical consolidation after a series of new records as we enter a period of seasonal weakness.
While the polls remain largely unchanged in a 50-50 country, much has changed relative to the historical comparisons for market performance. With President Biden’s withdrawal, the election is no longer considered a “re-election” and is now an “open election,” the historical significance of which points to higher volatility and lower return potential in the months ahead. See chart: S&P 500® Avg. Returns in Re-Election vs. Open Election Years.
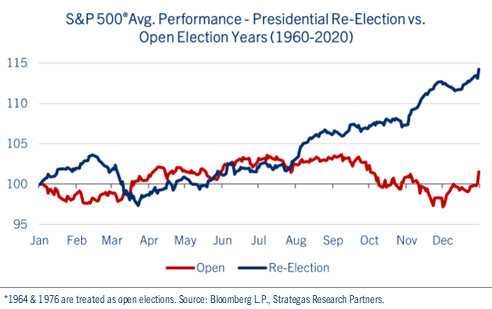
History shows the late-July and early August period as a defining “break” for the S&P 500® Index during presidential election years. Re-elections tend to be more positive as investors appreciate the relative clarity ahead of the vote, while open elections typically are associated with more uncertainty and hence, elevated market volatility.
In addition, the performance of the S&P 500® in the 90-days prior to the election tends to be an accurate indicator (83% success rate) of the election’s outcome. Strategas Research Partner’s notes that since 1928, if the Index is up in the three months leading up to the vote, the incumbent candidate/party is victorious. Conversely, if the market declines during this timeframe, the opposition wins. On average, the S&P 500® declines fractionally (-0.66%) for the three-month period in open election years compared to the gain of +3.66% in re-election years.
Of course, more surprises are possible over the next 100 days, so let’s keep the focus on fundamentals including the direction of the economy, interest rates and corporate earnings when making investment decisions.
Market Interest Rates
Bond traders are likely to force the Fed’s hand.
Since the better-than-expected June CPI report, the yield on the 2-year U.S. Treasury bill has declined by approximately 35 basis points, to ~4.40%. The benchmark 10-year Treasury note fell roughly 10 basis points to 4.20%, further steepening the yield curve and bringing a positive slope within sight. See chart: U.S. Treasury Yield Curve.
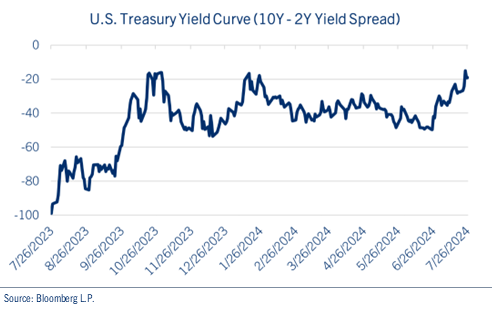
While the benchmark 10-year Treasury factors into all manners of financing throughout the economy, we view the 2-year bill as more indicative of the direction of monetary policy. To this end, the spread between the upper bound of the Federal Funds rate (5.50%) and the 2-year Treasury is now greater than 100 basis points, suggesting the necessity for monetary policymakers to act soon.
We look for this week’s FOMC meeting to likely send a signal for a September rate cut, as policymakers need to balance the stronger than expected second quarter GDP report with trends for weakening inflation and employment data. Though market expectations include policy accommodation through next year, we suspect the Fed may prove more cautious, likely reassessing the impact of two rate cuts in the coming months, which would bring the Federal Funds rate in line with nominal GDP – approximately 2.0% GDP with ~3.0% inflation.
Equities
After a strong start to the year, the equity markets have encountered headwinds, particularly in the large cap space, as equal-weighted measures and small caps have secured a bid. See chart: S&P 500® Index.
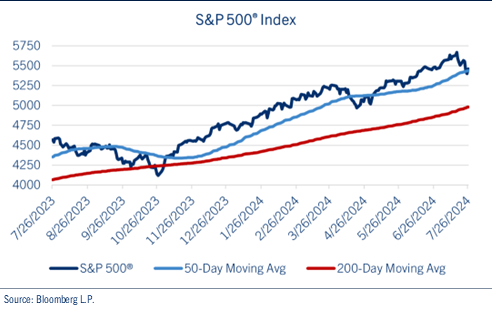
We believe the weakness in the S&P 500® over the past few weeks is reflective of a combination of events and not just AI or the elections.
Second quarter earnings are coming in below expectations with little in the form of guidance to justify consensus expectations for 4Q and 2025. Corporate spending on AI has been significant, valuations in the space are elevated and investors are beginning to question the potential AI payoff. Consequently, traders are taking some profits off the table and seeking returns elsewhere.
The small cap space has been a big beneficiary of this trend, with strong momentum gains relative to large caps (~1,000 basis point) over the past few weeks. To be sure, small caps can benefit from Fed rate cuts in the coming months, but its conceivable monetary policy makers are likely to reduce rates 1-2 times, without a protracted easing cycle in 2025.
In addition, the profit landscape in small cap stocks is broad. For example, the Russell 2000 Index has approximately 40% of its constituents without earnings, while in the S&P 600, just 15% or so are unprofitable. Therefore, we encourage investors to go “up in quality” on their small cap exposures.
Finally, the election and seasonality are bringing an increase in volatility. The parlor games have already started relative to beneficiaries of extended tax cuts and reduced regulation (small caps, cyclicals and value) in a Republican administration, with consumer stocks, clean energy and some healthcare related industries poised to outperform should the Democrats retain the White House. At this point, we view these as speculative trades and encourage investors to maintain diversified, long-term strategies within their portfolios.

